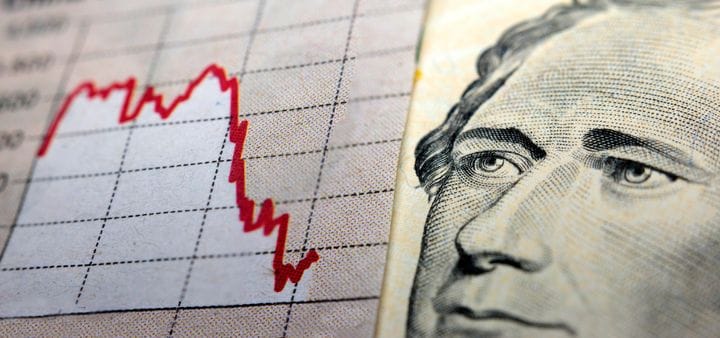
Can the FED Engineer a Soft Landing?
Are we headed for hard times in the face of Federal Reserve tightening? To understand this, we need to analyze the role of a budget deficit in a recession.
Are we headed for hard times in the face of Federal Reserve tightening? To understand this, we need to analyse the role of a budget deficit in a recession.
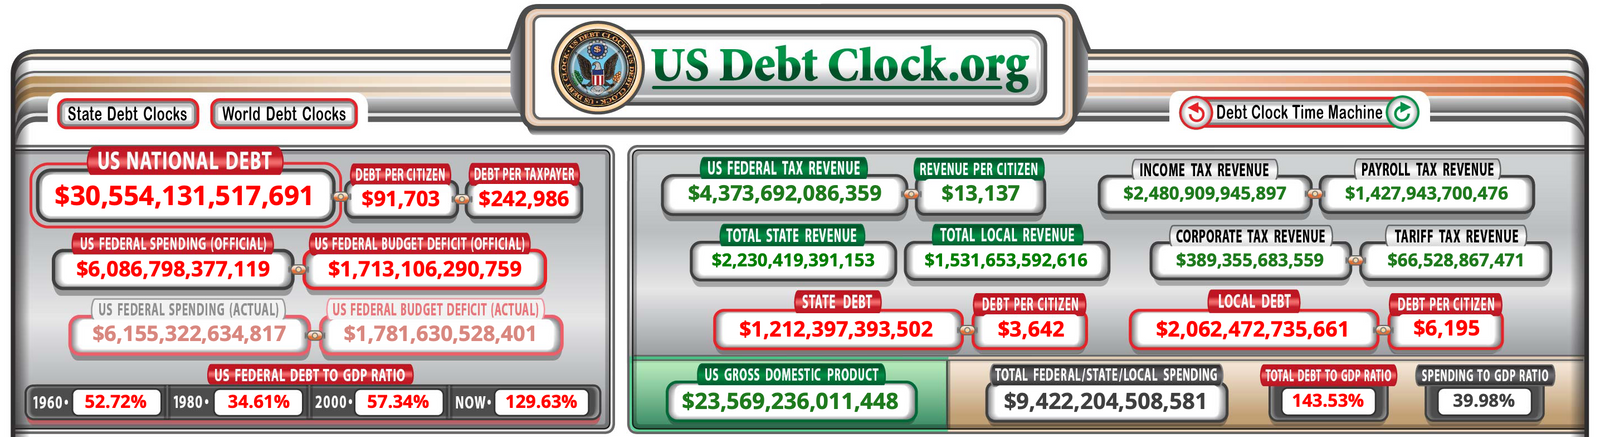
A balanced budget is when the government spends exactly the amount of money it collects in taxes, and we rarely see this, at least with major world governments such as the United States government. Additionally, though just as rare, we have a budget surplus when the government collects more tax revenues than it spends. We have the normal state of affairs—a budget deficit—where the government spends more money than its tax revenues. Currently, the U.S. government is running a federal budget deficit of about $1.7 Trillion, as shown in the U.S. National Debt Clock below.
Increased Government Spending
The crucial thing to realise here is that federal budget deficits always increase during recessions. Given the U.S. government creeping into a recession and already spending $1.7 Trillion in deficit, I foresee a deficit spending increase for two primary reasons:
- Fall in Income Taxes: Companies are forced to downsize by laying off staff, subsequently driving higher unemployment rates and lower income tax revenues overall.
- Fall in Capital Gains Taxes: The combination of illiquidity and higher interest rates, contracts earnings, and price-to-earnings multiples, therefore resulting in fewer capital gains tax revenues due to lower asset valuations in housing, stocks, bitcoin, and crypto.
The government must spend more money because it needs to pay unemployment benefits for the newly unemployed and pick up the slack from the private sector. As the private sector is weakening, the government needs to step in and prop up Gross Domestic Product (GDP) at the very least, which is the Keynesian thought process. Whether this is a good idea or not, this is, in fact, a common theme during recessions. . The tax revenues fall, and government spending goes up; remember, the U.S. government has been running budget deficits for the past 20 years—of which the last surplus was back in 2001 and the result of the dot-com boom in the late 90s to 2000. During that time, the U.S. government was collecting a substantial amount of capital gains taxes and spending less than these tax revenues. However, it's been having budget deficits ever since.
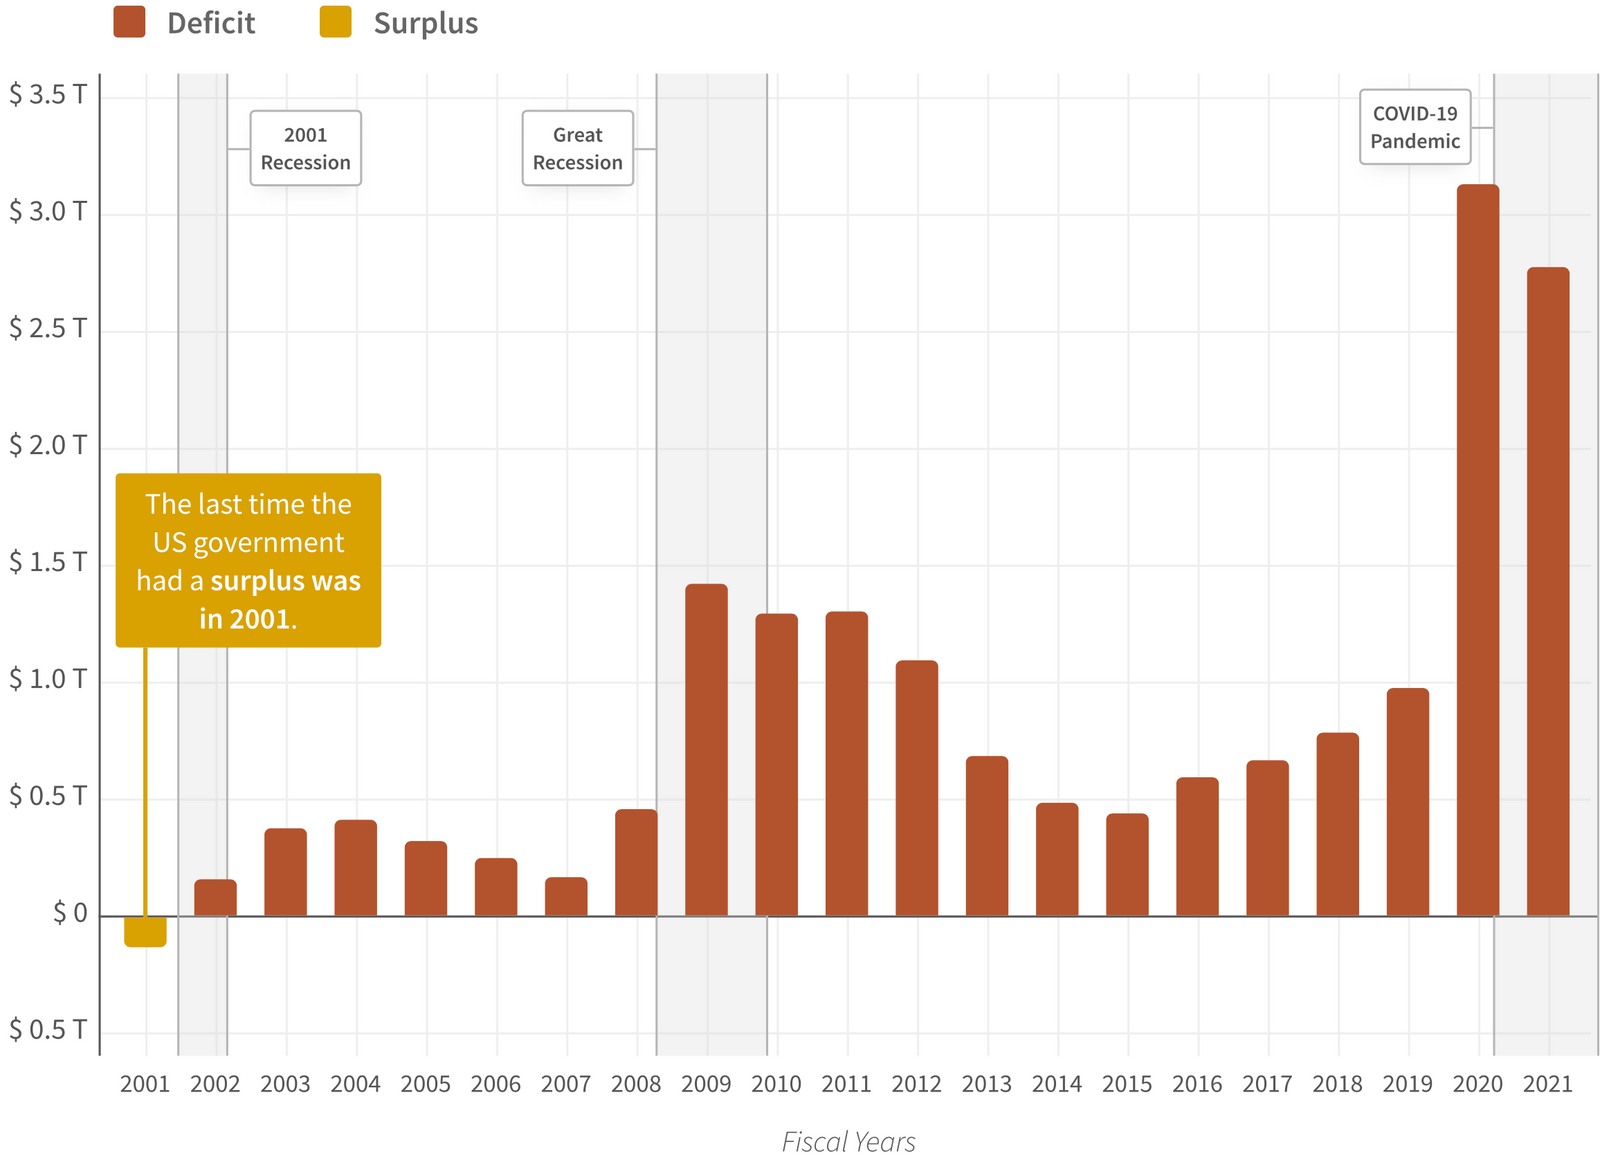
The chart below depicts the U.S. Federal deficit spending over the past 20 years; the red bars each represent one year of budget deficits, which steadily rose massively over time, and especially spiking during the periods highlighted as grey bars representing periods marked by a recession.
When a country plunges into a recession, it results in increased government spending, hence the spike in budget deficits. A more precise way to look at budget deficits is to view them as a percentage of the overall economy represented by the GDP, as that is constantly changing. For example, the U.S. economy is much larger now than it was in the 20th century.
The chart below depicts the Federal deficit or surplus as a percentage of GDP. From this, it becomes evident that most of the time, it is below zero (see the y-axis); therefore, most times, the U.S. government is running budget deficits, and these values are normalised to be a percentage of the U.S. economy.
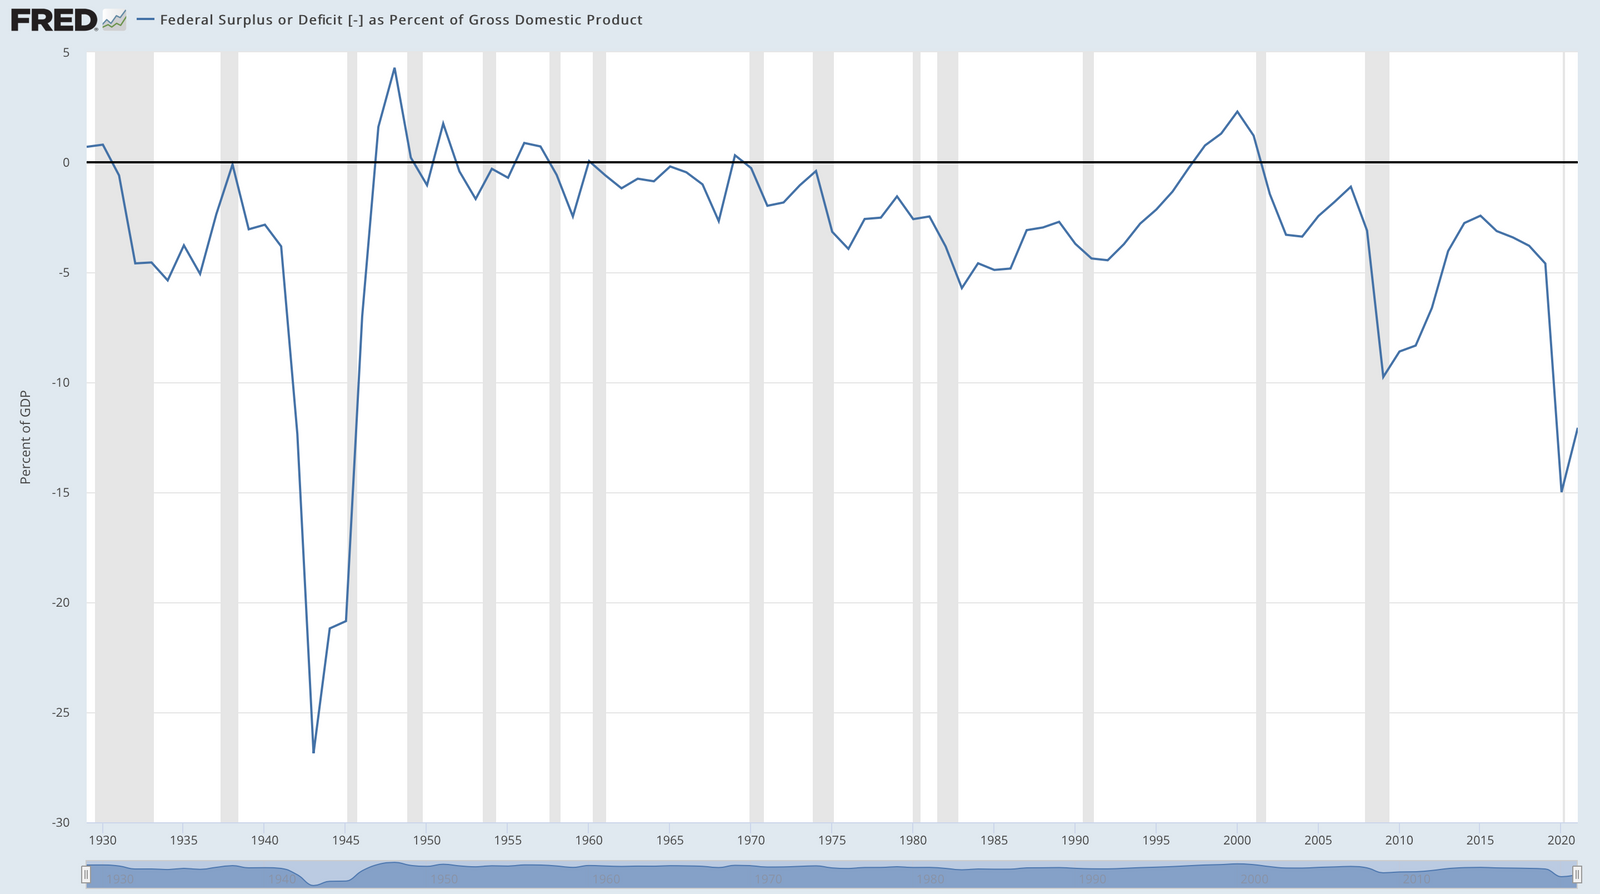
In 2020, the U.S. budget deficit was ~15% of the country's GDP and, hence, 15% of the size of the economy. While in 2021, the budget deficit shrank to only 12% of the economy's size. For example, we can establish from the charts above that in the last two recessions:
- 2001 Recession: The budget deficit, as a percentage of GDP, increased by about five percentage points, starting at ~2.3% in surplus in 2000 and bottoming off during the bear market to -3%.
- Great Financial Crisis: From 2007 to 2009, the budget deficit rose from -1% of GDP to about 10% to 9.75%.
The chart also highlights periods when the U.S. economy enters a recession, with more significant budget deficits due to increased government spending. As a percentage of GDP, these budget deficits range from 5-10%, which is crucial in projecting a potential increase in government spending.
According to the U.S. National Debt Clock, all the goods and services produced in the U.S. measuring the size of the operating economy is approximately 23.5 trillion. When the budget deficits increase during this current recession, similar to the last two recessions in 2001 and 2008, with budget deficit increases ranging from five to ten percent as a percentage of GDP.
We highlight the resulting increases in the budget deficit in these two ranges:
At a 5% increase (as a percentage of GDP)
$23.5 Trillion * 0.05 = $1.175 Trillion increase in the budget deficit
At a 10% increase (as a percentage of GDP)
$23.5 Trillion * 0.1 = $2.35 Trillion increase in the budget deficit
The ranges are increases in new government spending that are neither met by tax revenues nor equalised by tax revenues. The vital thing to note here is when this happens, the government needs to pay for them by issuing new debt via the issuance of treasuries, as these are new amounts. Suppose the economy enters a recession, which, based on current market behaviour, we can conclude we are currently in. In that case, we should expect to see budget deficits blowout by those above-mentioned ranges. Consequently, this must be paid for with new debt. Therefore, the government needs buyers to step in to purchase between 1.175 and 2.35 trillion of new debt.
The issue mentioned above is even further exacerbated, as the U.S. government is currently running a $1.7 trillion budget deficit according to the U.S. National Debt Clock, and assuming as a percentage of GDP, the budget deficit increases within the range of 5-10%.
At a 5% increase (as a percentage of GDP)
$1.7 Trillion + ($23.5 Trillion X 0.05) = $2.875 Trillion in budget deficit, which brings the deficit to 12.23% of GDP
At a 10% increase (as a percentage of GDP)
$1.7 Trillion + ($23.5 Trillion X 0.1) = $4.05 Trillion in budget deficit, which brings the deficit to an astonishing 17.23% of GDP
Who is going to buy the new debt?
Recessions with higher budget deficits result in more debt, and hence the natural question arises—"Who is going to buy the new debt?" We can assume it will not be the Fed, as they currently aim to shrink their balance sheet. Thus, presently, the Fed is not buying, at least not for a while, until they're forced to expand their balance sheet. Similarly, it will also not be a country like Russia because the U.S. froze its treasury reserves, making it apparent to other Sovereign buyers how politicised the U.S. Dollar truly is.
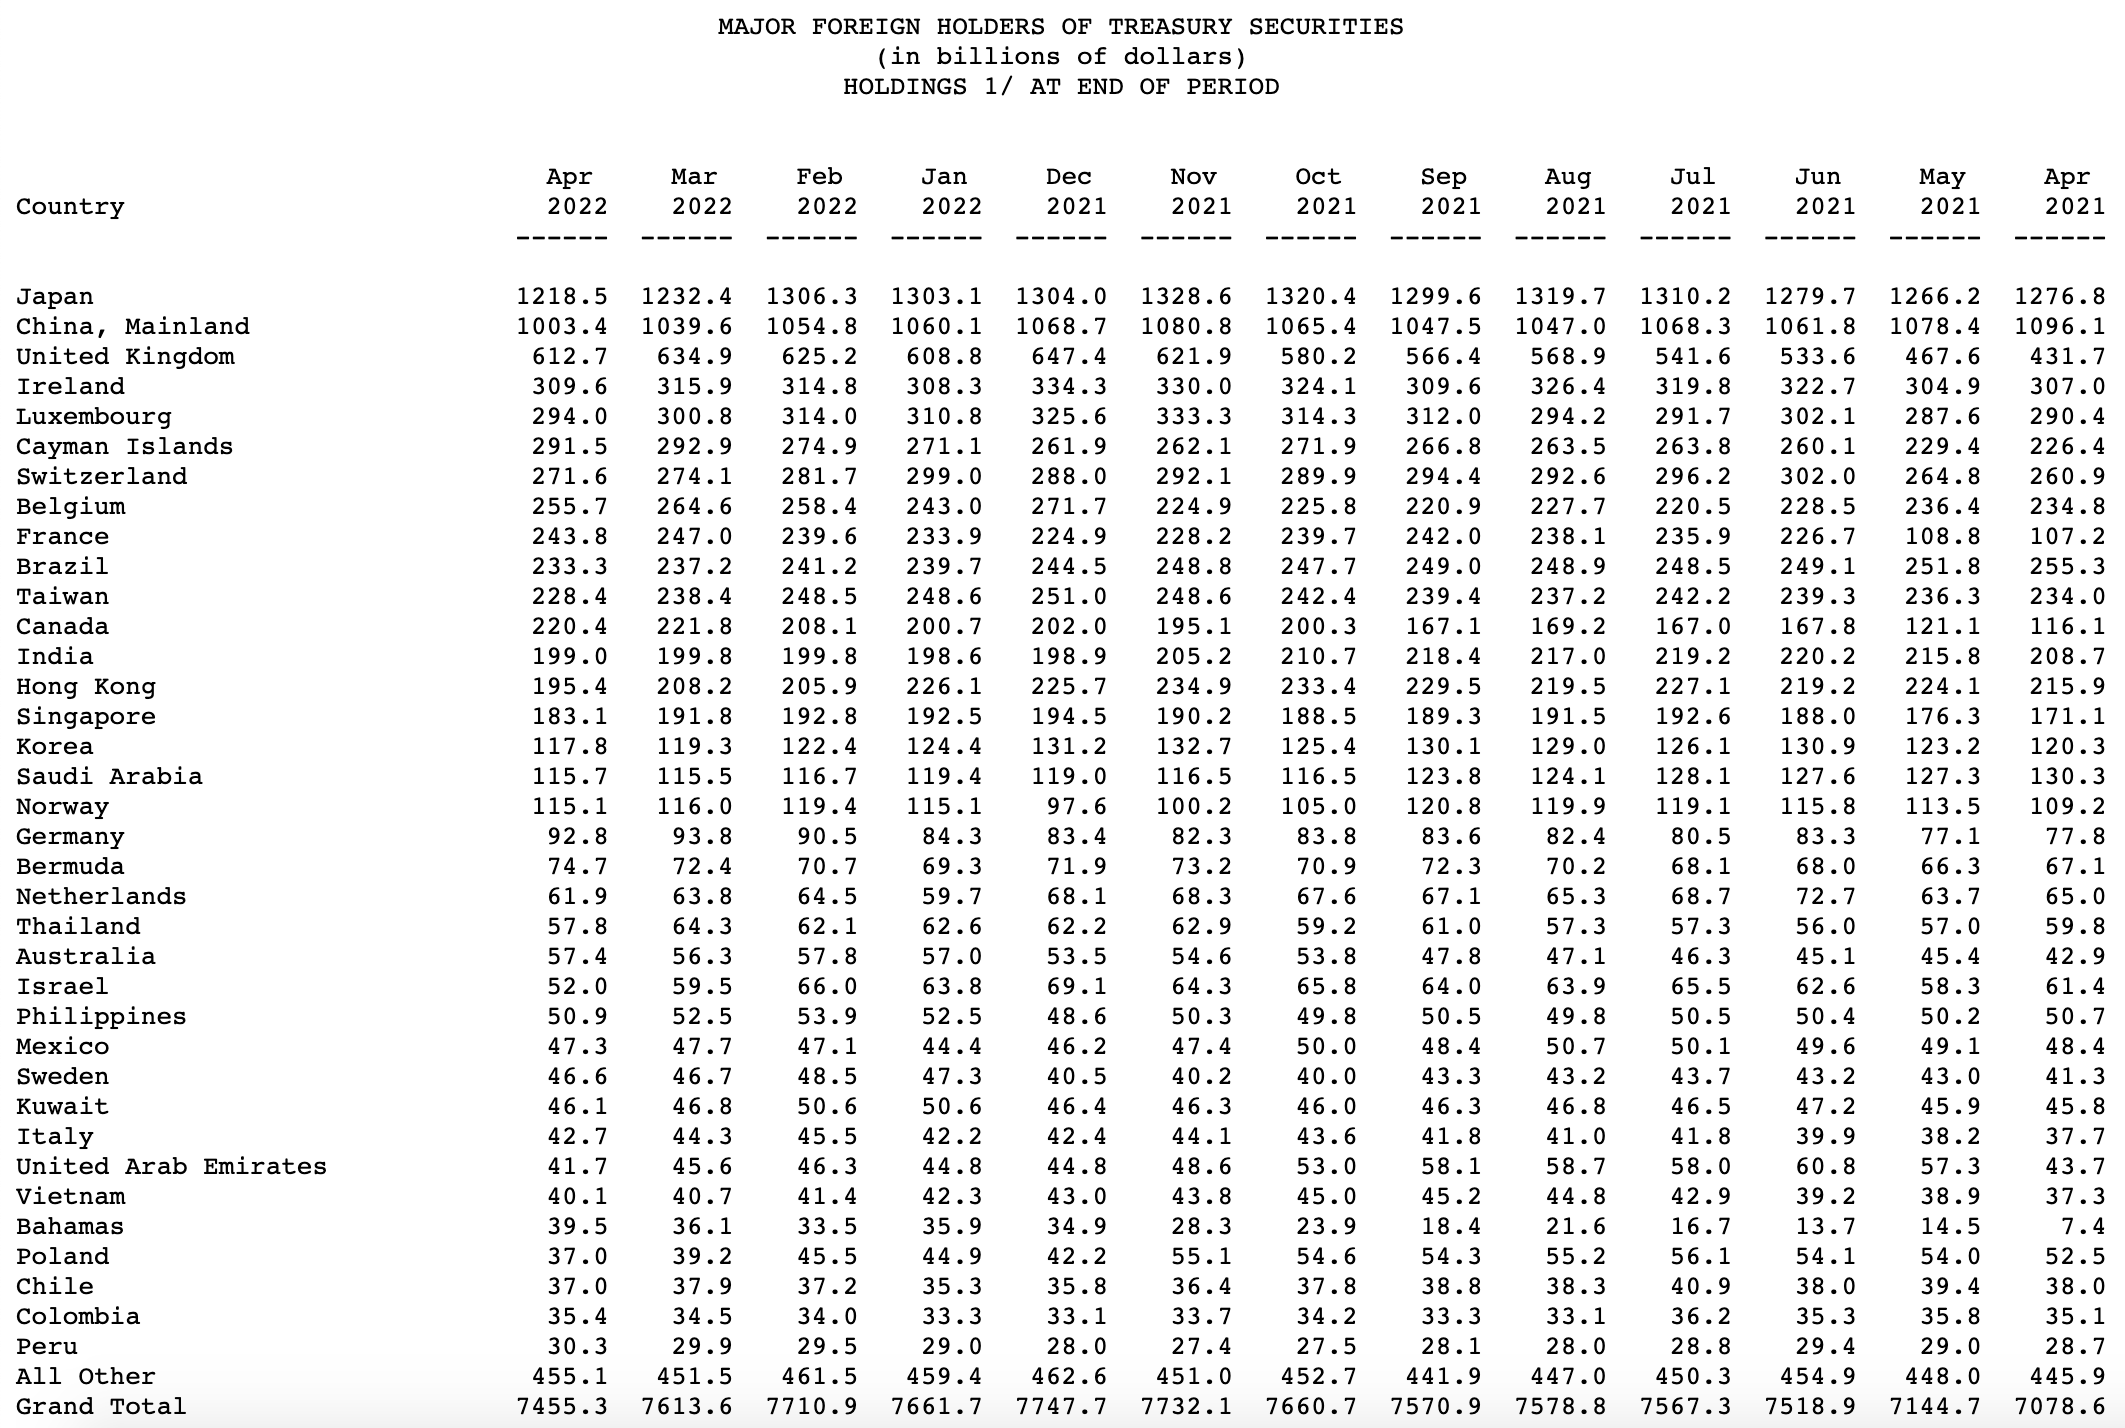
Sovereign buyers understand it sets a precedent for confiscating their U.S. treasury reserves. For this reason, countries such as China and Japan, the largest creditors of the U.S., have been selling off their U.S. treasuries recently. According to a Reuters article by Gertrude Chavez-Dreyfuss, China's holdings have fallen to a 12-year low. Additionally, Japan is shedding its holdings, as shown in the treasury data below—which shows the holdings of Japan and China and how they've changed over time.
The U.S. government is experiencing this issue amid increasing budget deficits and is required to issue more debt. However, neither the Fed nor sovereign buyers such as China and Japan are buying, and unless major buyers step into the bond market, interest rates will continue to increase.
Therefore, the question remains, how can this problem be solved?
Decrease in Asset Valuations
This year has been characterised by higher interest rates negatively affecting stocks, housing, bitcoin, and crypto valuations, as investors apply higher discount rates in their valuation models, lowering the fair value for a given amount of earnings across the entire stock market. The other problem with recession is that company earnings fall, exacerbating contracting valuations and falling earnings.
Higher interest rates negatively affect mortgages as they lead to higher mortgage rates, and assuming a constant spread when you have a crisis, the spread blows out. The net result of all this is things start to break, setting the stage for much lower stock and housing prices. We are already seeing early signs suggesting that it has already begun, as seen in the leading indicator and canary in the coal mine Bitcoin and crypto.
Bitcoin is off its highs of $69,000 and currently trading just below $20,000—a more than 70% decline. While all these implosions are happening in crypto, Luna is leading the drawdown that triggered Celsius and Blockfi's struggle for survival. Tech stocks have been spearheading the drawdown in the stock market, while the real estate markets have been slower to react. Nevertheless, all signs are prevalent in the local market that U.S. housing is cooling off rapidly.
Historically, when risk assets are selling off, problems begin to emerge with Fed hawkishness as the U.S. treasury market begins to face liquidity problems. This problem in May made the headlines when spreads significantly widened in the treasury market, which is sincerely troubling as they are the deepest and most liquid market in the World.
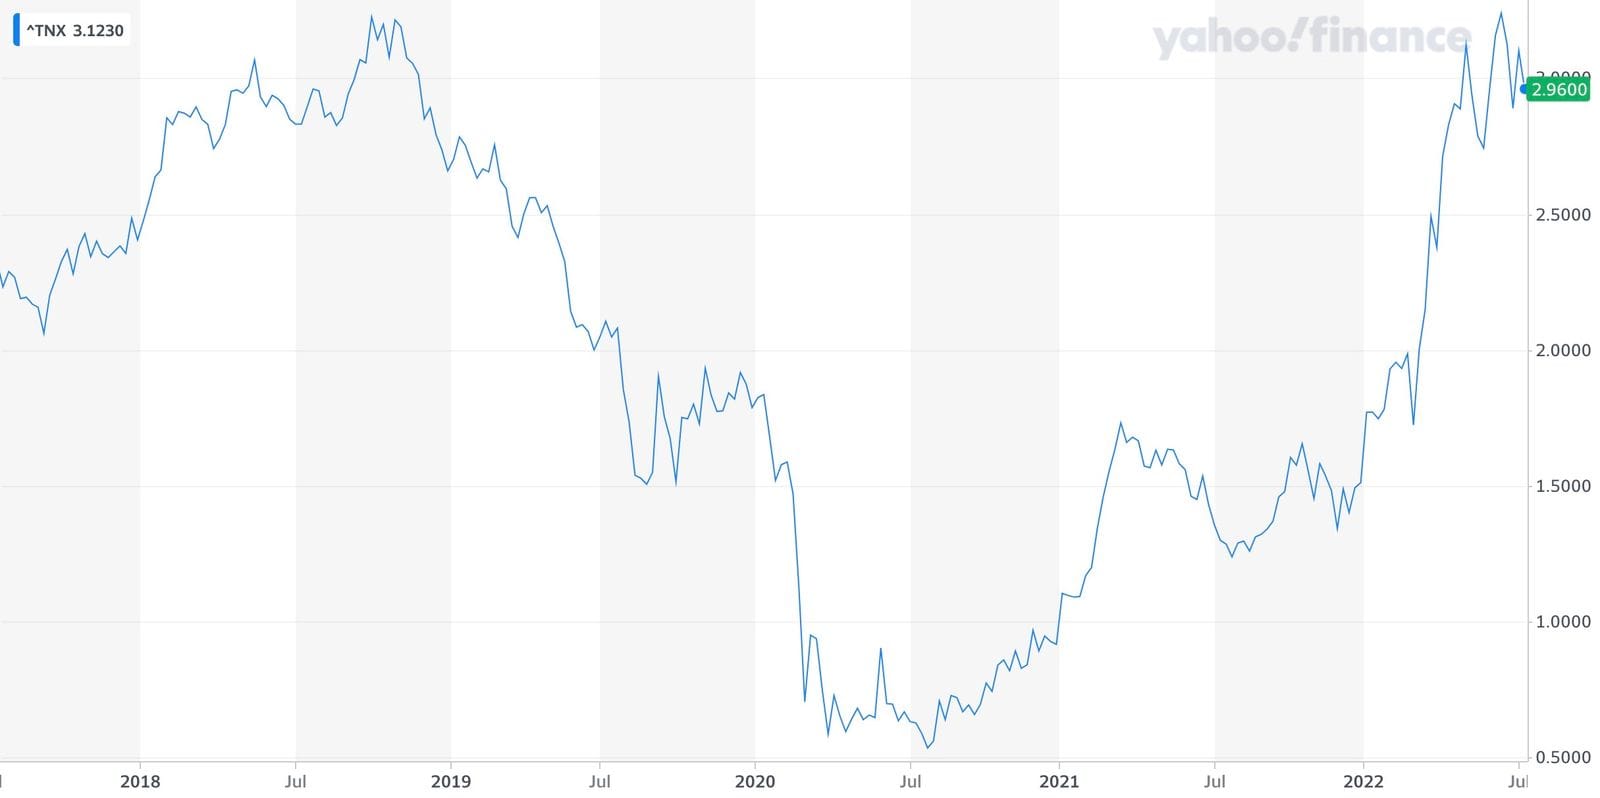
Observing the 10-year treasury note yields below, it quickly becomes apparent that the markets are very close to returning to 2018 levels which were roughly between 3% and 3.25%—i.e., the point when the economy started to break the last time. As the repo crisis will repeat, thus appears rates are peaking out again. The 3% level has been critical over the past few years. It has been challenging for mortgage tenure rates to go above that level because things start breaking at that point. Usually, this is when the Fed needs to reverse course by starting to buy treasuries and expanding its balance sheet.
There is a strange standoff happening mainly as Loretta J. Mester, the President of the Federal Reserve Bank for Cleveland, stated that the Fed is just at the beginning of raising rates, which are going to be very aggressive. As Jim Bianco from Bianco Research pointed out in his Twitter thread, asset prices will be negatively affected by this.
According to Bianco Research from the chart below, the year worse on record in the U.S. stock market was 1932, which was at the depths of the great depression. Observing the chart below, we can see from a year to date for every year stretching back to 1926, with blue representing 2022, green representing the best performance, and red representing the worst performance.
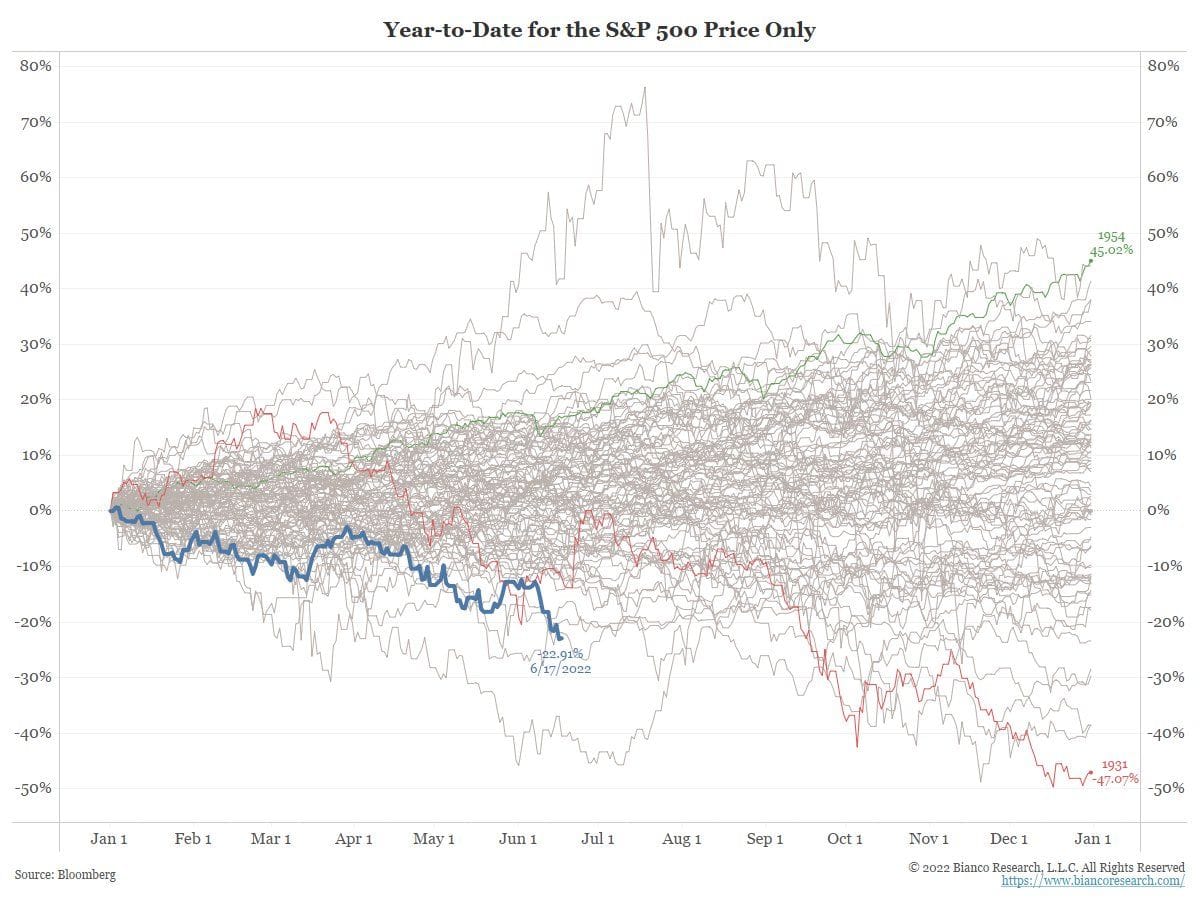
By June 17, the S&P 500 was down 22.91%, and only 1932 was worse, with 1962 coming close. What’s more alarming is if the year were to end here, it would be the 7th worst in history. Jim’s assertion that no one has seen anything like this year is entirely accurate.
While risk assets have been in free fall, the chairman of the U.S. Federal Reserve, Jerome H. Powell, stated that the Fed is not trying to provoke a recession. Although reality paints a different picture, given they need to play a balancing act on both sides to achieve a soft landing. Additionally, a soft landing would mean inflation coming down without a stock market crash. Nevertheless, it’s ending up with a sharp stock market sell-off, as observed in the chart above. The problem is that Powell needs to keep the balance on both sides: he wants to invoke much lower aggregate demand to bring down food and energy prices and, at the same time, hold off saying we’re going into recession to avoid scaring the markets. Consequently, we now have a game of chicken between the Fed and the markets, bringing up the question of who blinks first, and so far, the markets have been calling the Fed’s bluff by selling off very sharply. We see this exemplified best by the sharp sell-off in risk asset prices for Bitcoin and tech stocks, all the way to the border market indexes.
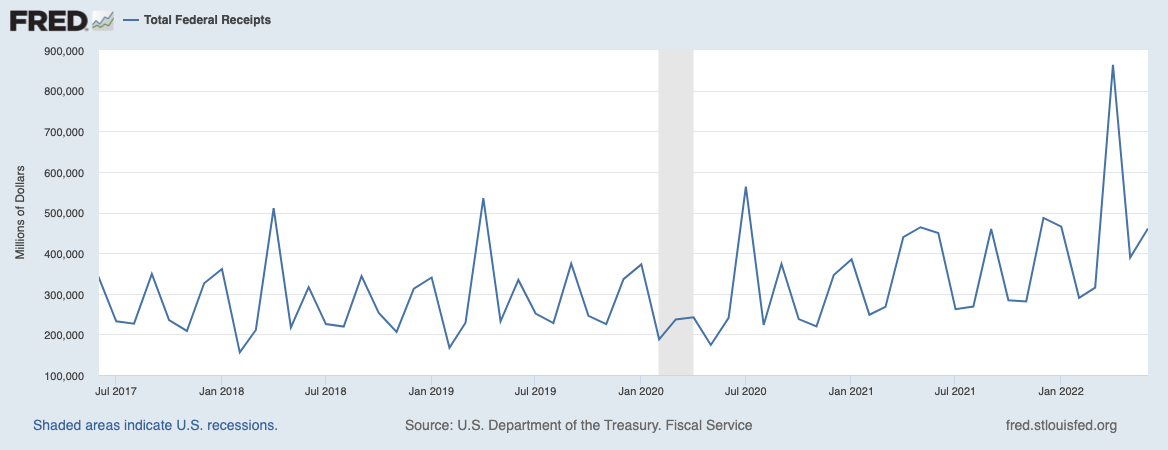
As shown below, Federal tax receipts are also plummeting, they're down 16% year-over-year from 2021 to date, and the reason they've declined so far is evidently due to the state of markets being down. Thus, as previously established, it is apparent that people are paying fewer capital gains taxes, and lower tax receipts mean higher budget deficits and ultimately require more debt to be issued.
If inflation eases off in the coming months, the Fed may be able to halt the action. However, if inflation stays high partly due to the war between Russia and Ukraine, which continues to stubbornly high energy prices, they’d have to persist in their actions. Is the Fed willing to keep crashing the markets? Doing so could instigate a housing market crash going into the November midterm elections. Therefore, it is very apparent that it’s highly unlikely the Fed would be able to engineer a soft landing, as markets are headed for a very HARD LANDING, and unless the Fed reverses course, we can expect to see a continued sell-off in stocks, bitcoin, and bonds, but perhaps it may already be too late
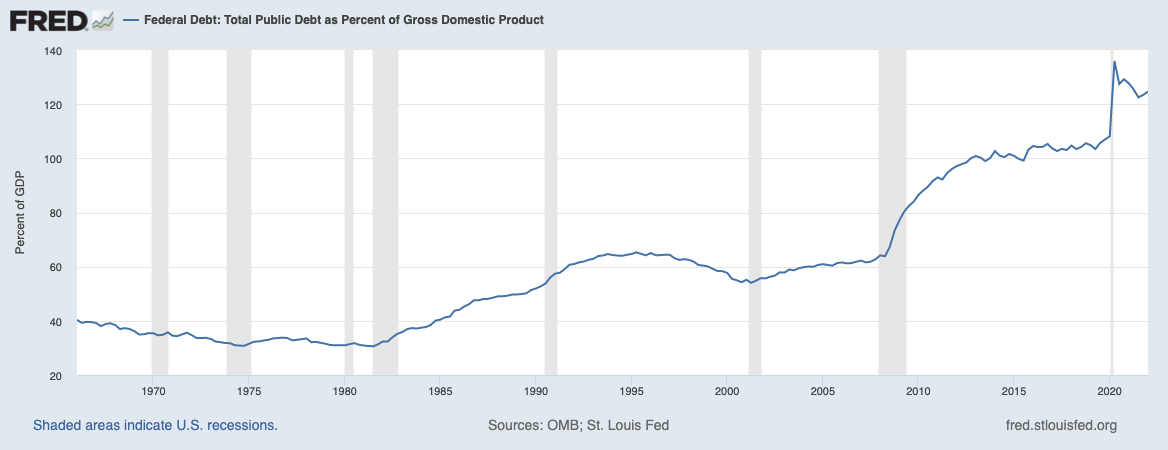
Something big will probably break this summer, and the Fed will likely need to reverse course before the end of September, if not sooner. What needs to happen here is that the U.S. needs to inflate its way out of debt as there are very few alternatives to the current Fed policy—essentially just delaying the inevitable. The natural way out of a situation like this is through inflation. Unfortunately, the current debt-to-GDP ratios are unsustainable at ~125% (as shown below). It needs to be reset back to historically more sustainable levels of 60-70%.
Conclusion
In this current situation, a hawkish Fed has already driven the U.S. and Global economy into a recession. As established in this piece, a recession always comes with higher budget deficits, and as such, the U.S. government is in the process of needing to issue more debt. The problem with the U.S. government issuing more debt as the economy slips into a recession is that the debt-to-GDP ratio goes up, not down. We expect this to be the case, as the amounts of debts are increasing and the GDP is shrinking. In recessions, you typically experience a shrinking GDP for two quarters or more.
Debt-to-GDP Ratio = Debt ∕ GDP
↑Debt = ↑Debt-to-GDP Ratio ≠ ↓Debt-to-GDP Ratio
↓GDP = ↑Debt-to-GDP Ratio ≠ ↓Debt-to-GDP Ratio
To achieve lower debt-to-GDP levels, the Fed needs to let inflation run hot for a few years, and eventually, they will likely take this path. What markets are experiencing this year is just a temporary aberration. It is much more politically palatable to have rising stocks and housing prices, even if consumer price inflation remains high.
Historically, politicians that choose austerity and central bankers that choose a protracted hawkish policy get voted out and replaced with politicians and central bankers who want to have looser monetary and fiscal policies—voters are happy when a lot of spending happens via government expenditure.
I expect the Fed to reverse this hawkish trend by the end of September this year, and the money printers will go back on! Consequently, we should brace for stocks and Bitcoin to rally again as there's no foreseeable alternative. The deflationary path taken by the Fed will need to reverse, and they'd need to start buying and monetising U.S. government budget deficits.
At this point, we can only brace in and anticipate the Fed adopting the more appropriate approaches explored in this piece to engineer a soft landing.
This is an opinion post by Ramadan. Opinions expressed are entirely their own and do not necessarily reflect those of Recursive Capital.